This page catalogs techniques for representing security data visually. Clear, cogent, meaningful visual displays of information enable the audience to rapidy grasp the essence of security issues and trends. Below are some examplars, many of which come from outside the world of information security. ( Wikipedia definition: Information Visualization )
Summarizing Clinical Psychiatric Data (November 1997) - Edward Tufte popularized a highly efficient charting technique called “small multiples.” The technique essentially graphs multiple items together, by compressing identically-scaled and labeled graphs onto a single chart. Tufte’s article on visualizing clinical patient data shows the small-multiple technique in action. With a little imagination it is easy to see how this can be applied to security. As an example, see Jaquith’s Application Security: Not All Are Created Equal paper.
The New York Times Election Graphics. InfoWorld columnist and blogger Jon Udell scanned in a stunning chartthat displays the “small multiple” technique plus some extremely creative “geographic” visualization. This appeared recently in the NYT’s print edition as part of the 2004 US election coverage. Jon believes his scan falls into the realm of fair use. We hope so too.
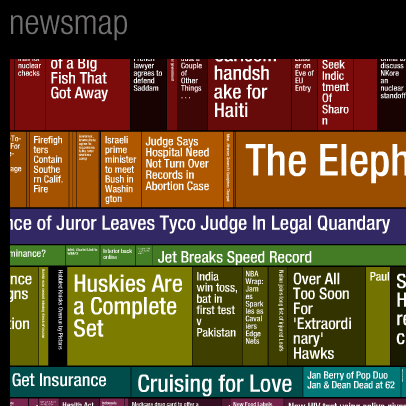
Newsmap, The Hive Group. Intriguing, compact dynamic ’treemap’ graph showing Google News’ top stories. Each story is represented by a block; the size is determined by the number of links to each story; the color saturation, by the ’newness’ of the story. This is a tour de force demonstration of what an effective treemap should look like. An excellent paper published by researchers at the University of Maryland explain the visual model of treemaps.
Wijk, J.J. van, F. van Ham, H.M.M. van de Wetering. Dr. van Wijk’s “squarification” algorithm (as used by Newsmap, above) is already the de facto standard for treemaps. What do do for an encore? In this short ACM paper, he and colleagues examine strategies for visualizing large, tree-like structures: treemaps, beamtrees, and “botanical” graphs.
Freshcookies Treemap Library, Andrew Jaquith. As part of the research effort for his book on security metrics, Mr. Jaquith has created an open-source treemap library and a sample file-parsing application that reads tab-delimited text files. The library was used to produce the treemap graphics attached to this page. It is easy to use, well documented and free (as in beer).
The Spinning Cube of Potential Doom, Stephen Lau, Lawrence Berkeley National Labs. The author’s custom three dimensional visualizer charts intrusion activity, based on output from the Bro network intrusion detection system. The related presentation explains the rationale. Yes, yes, one does appreciate the irony of linking to a PowerPoint presentation on the same page as a Tufte article.
Visitorville Weblog Analysis, visitorville.com. As covered in Slashdot, weblog analysis meets SimCity. This product aggregates web log information and displays it as a three-dimensional cityscape. Very interesting; its potential utility to security metrics seems pretty clear. The ensuing Slashdot discussion thread was entertaining also.